arscpp
arscpp is an R package providing an interface to my own c++ implementation of the Adaptive Rejection Sampler. Its key features are that it is significantly faster than exising implementations and functions as a ‘black-box’, relieving the user of the burden of determining meaningful starting values.
Adaptive Rejection Sampling
The arscpp package implements the Adaptive Rejection Sampling (ARS) algorithm (Algorithm AS 287) by Wild and Gilks (1993). ARS allows sampling from abritrary univariate log-concave densities. Importantly, the density does not have to be normalized, so ARS is particularly useful for Bayesian inference problems.
Without going into any detail, ARS works by building a piecewise log-linear density function (called the ‘upper hull’) that serves as a proposal distribution for the rejection sampler. In addition, the algorithm defines a piecwise log-linear lower-hull that allows performing the rejection step without having to evaluate the target density at every iteration. The algorithm is ‘adaptive’ because the upper and lower hulls get adjusted to fit the target density more closely with every rejected sample. The animation above illustrates this procedure, showing the sampling of 100 points from an unnormalized standard normal density using ARS. The red and blue lines correspond to the upper and lower hulls, respectively. The animation shows nicely how ARS leads to a near optimal proposal distribution as the number of samples increases.
library(ggplot2)
library(ggthemes)

# Normal log pdf
f <- function(x, mu, sd) {
  -0.5*(sd^(-2))*(x-mu)^2
}

# Derivative of normal log pdf
f_prime <- function(x, mu, sd) {
  -1*(sd^(-2))*(x-mu)
}

# Prepare the sampler
sampler <- arscpp::ars(f = f, f_prime = f_prime, x = c(-1, 1),
                       mu = 0, sd = 1)

# Draw 1e4 samples
set.seed(1)
x <- sampler$sample(1000)

# Plot samples against theoretical quantiles
df <- data.frame(x = x)
p <- ggplot(df, aes(sample = x))
p + stat_qq() + stat_qq_line() + theme_economist()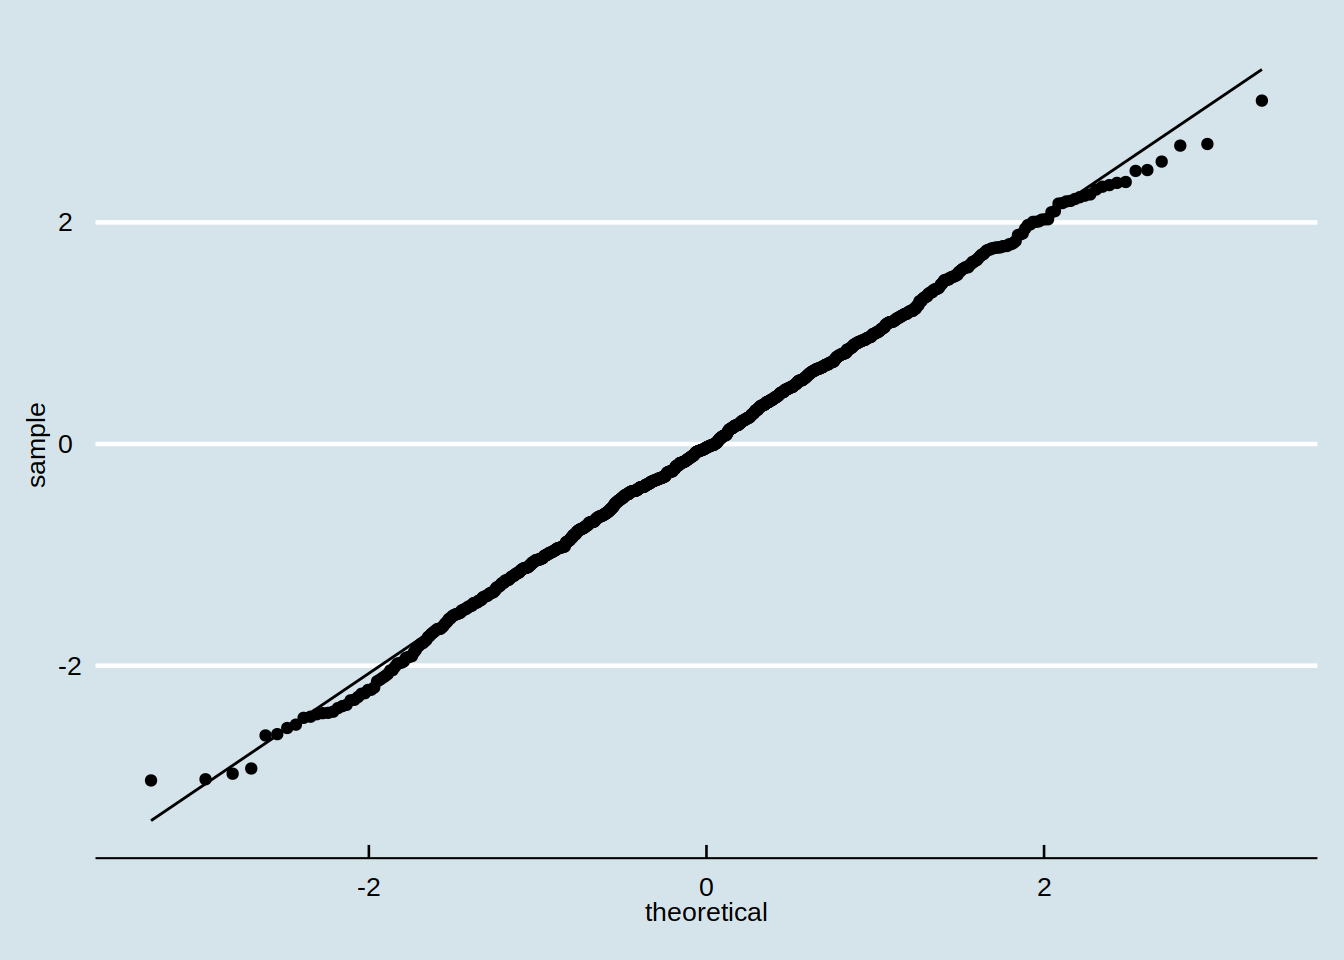
Figure 1: A normal QQ plot of the ARS samples.